Garmin Golf Data Processing
Using:
Updated on: January 12th, 2024
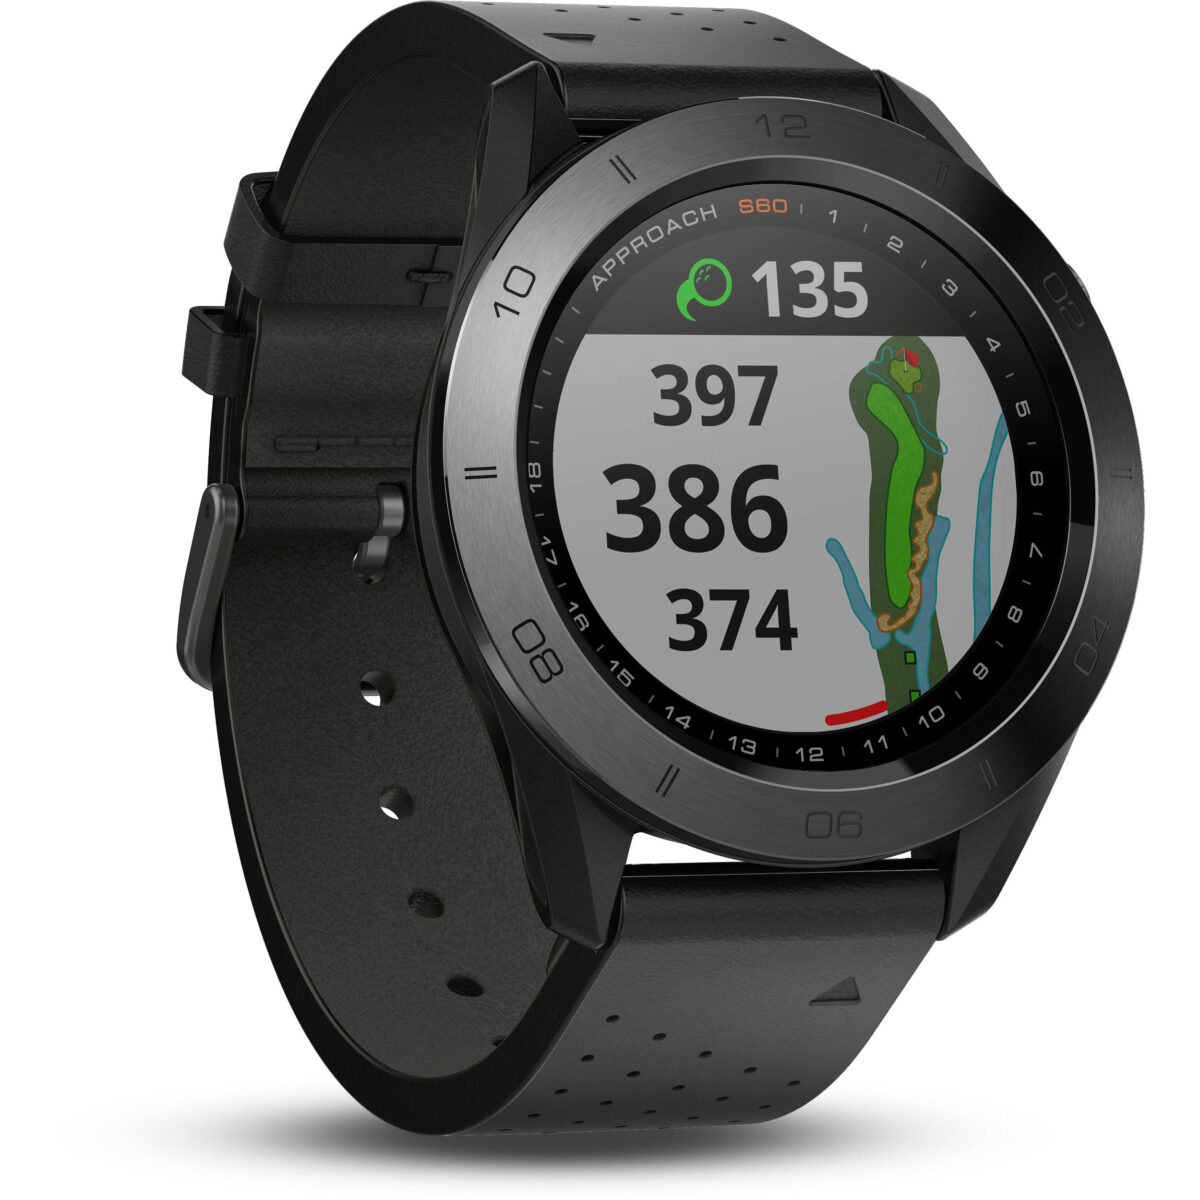
Having moved back to the midwest in late 2021 I decided to get back into golf after a 6 year hiatus in the summer of 2023. Having been a runner for most of my adult life I wear a Garmin watch which happens to have a ton of golf features and has been a consistent piece of kit on the course.
Utilizing Garmin’s ability to download all data from their services I’ve created a script that will take the Golf portion of the data and parse it into a sqlite database. This takes the folder from the garmin zip file and separates out the data feeds into multiple tables:
club – list of the clubs you’ve added into the app flag of is_retired for Y/N of if it is an active or old club in your bag
club_type – “Plain english” description of the clubs. Club table uses clubtypeid. For the most part clubs can be ordered by the ID (ascending) and they will show up in terms of length of shot they hit. If you have less common clubs (7 wood, 9 hybrid) they won’t be in the exact order as those IDs are higher than some of the wedges
course – list of courses you have played and have a scorecard attached to them. The ID here is a little weird as it relates to the coursesnapshotid in the scorecard table
hole_history – stats from each hole you have played including the length, par, your score, total strokes, and handicap info
scorecard – data from each scorecard you’ve tracked. The scorecard_name does not match the course.name from that table since this is sourced from the .fit files
shot – each shot tracked with gps coordinates converted from integers to degrees lat/lon
Some of the tables require the parsing of .fit files. These files are what gets displayed in the golf section of Garmin Connect:

These are merged with the json data to fill in some of the par target data
On top of the ETL process to get the golf data into a query-able database there’s a need to understand the data and create a summary of the data to learn from it. This is done via streamlit and the plots are created using plotly. As of now I’ve settled on a couple core visualizations.
Visit the interactive graphs at golf.wittdata.com
View the source code for the streamlit app on github: https://github.com/benwittbrodt/streamlit_golf
First being a club gap analysis. Ideally each club you have should occupy its’ own space in the distance (Y) axis with very little range other than what’s desired. Clearly I have room to improve here…

Second is a fairway accuracy measure from tee shots broken down by club and either number of shots, or percentages.


Traditionally I use my 3 wood off the tee as my accuracy with the driver isn’t great and you can see that by the sheer difference in the number of shots off the tee between my 3 wood (over 100) and the driver (about 50). Future work will be to relate this to the length of the hole and understanding the resulting shot distance to see if there is a good way to optimize the length of a hole to the club I hit.
Third is a scoring performance breakdown by hole par target. I’ve done this overall and by hole par (3, 4, and 5)
Overall Performance

Par 3 Holes

Par 4 Holes

Par 5 Holes
